Posts Tagged ‘metrics’

This blog is meant to be about things I’ve learned, whether through courses/training/talks or through my own mistakes.

I realised that I haven’t really spoken about my recent journey from story points/velocity to the liberating world of throughput, Monte Carlo, and data-based probability forecasting. Liberating because instead of endless time spent “sizing” and arguing about what to size or how to size it, now all I need to help my team get feedback (and help my Product Owner give forecasts) is to pull data about what has actually happened. Most of the time, the team doesn’t even need to be involved: they can merrily continue doing value-add activities.

The one downside is, people don’t always like the answers the numbers give them.

Before I continue, I’d like to add a disclaimer. Statistics hurt my brain. I rely heavily on tools and techniques advocated by people a lot smarter than me. If you’re in any way interested in learning more about the topics I’m about to mention, please look up people like Dan Vacanti, Prateek Singh and Troy Magennis. I’ll add some links at the end of this to sites and blogs that have helped my teams and me get to grips with the basics, but I am not qualified to explain how this works. I understand why it works, I just can’t explain/teach it.

First, some background. I have always found story points and velocity extremely painful to work with when it comes to forecasting. Planning Poker can be a good tool to help a team have a conversation and check in that people are on the same page regarding how big something is, but once we know no one is sitting on a piece of hidden information or an assumption that no one else in the room is aware of, to use them for anything more becomes super complicated and “fragile”. And I’m not even talking from a statistical perspective (ref. Flaw of Averages.). If you’re using velocity for forecasting, there are plenty of sizing antipatterns out there, WHICH MOST PEOPLE DO ALL THE TIME, that break it. I’m not going to go into these now. I’ve spent years trying to explain/teach about sizing antipatterns. One of the greatest reliefs about abandoning velocity as a planning tool is that I no longer have to worry about it! If teams find sizes helpful (especially when transitioning), then they can do it when and how they want to, but I no longer use velocity for forecasting so it truly doesn’t matter what their number is at the end of the day – or even if they capture it anywhere.

So what is this magic and how does it work?

The first bit of magic is throughput. How many items your team completes in a period. (If you’re doing Scrum, your period is likely to be a sprint, but the period can be however long or short you want or need it to be, as long as you always use the same period across your calculations i.e. don’t use throughput based on sprints (weeks) to try to forecast based on days.) Now, you do need to agree and understand what done means. For some of my teams, done is ready for Production but not yet deployed. For others, it might be deployed to Production. It will depend on how your teams work and what is in their control. Again, what done is for you doesn’t really matter in this context, as long as it’s always clear what done means in your world. So the first piece of data you need, is 3-10 datasets, over a period similar to the one you want to forecast, which gives you how many things the team finished in each period. If you’re using a tracking tool, this shouldn’t be hard to get.

The second bit of magic is Monte Carlo. I am not qualified to explain Monte Carlo or how it works. Luckily someone else has done a really good job of doing it for me in this Step-by-step Guide to Monte Carlo Simulations. Monte Carlo answers two very common questions:

  • How many things are you likely to complete in this amount of time? And,
  • How long are you likely to take to complete this many things?

And the best thing? Probability is built in! So you can say we have a 50/50 chance of completing this in 3 months or less but an 85% chance of completing this in 7 months or less. And what inputs does this wonderful magic need? Just your throughout. That is all. No estimating or sizing. No sitting in rooms trying to break things down. No arguing over capacity and approaches and such like. Just counts of things completed in periods.

So I can hear some people already have questions like “But things don’t take the same amount of time” and “What if it’s a really big thing – surely you need to know how many smaller things there are?”. The first concept that makes this easier is “right-sizing”. It’s always a good thing to break things down as small as possible (without losing value). So teams should still do this. And for your team, especially if you’re doing Scrum, you probably already have a “right size” in mind. Perhaps things shouldn’t take longer than two weeks to be done? Or perhaps a week? Whatever it is, agree what a “right size” is in your space to get something to your definition of done, and as long as most of the time things are about that size (or smaller) the outliers will work themselves out in the wash (you’ll have to either trust me on this or go learn more about “The Law of Large Numbers”). Related to right-sizing, there is also a very powerful feedback tool called “Aging”, but that will need to be a topic for another blog post.

The second question could be more complicated. If you have something really big you probably would break it down to do the work. The simplest way would probably be to go and look at work that you think was a similar size and count how many pieces that was in the end. Or if you want to use Monte Carlo to help you, here is an idea for how one could do it (although now it starts to feel like you’re in the “Inception” movie).

At the end of the day, you don’t have to trust me at all. If you’re curious, then I’d encourage you to run an experiment and use Monte Carlo forecasting in parallel with whatever technique you’re currently applying and compare the results. I’d be interested to hear what you uncover!

LINKS


My team had been working together for three sprints. During this time we’d been grooming and delivering stories (into Prod) but we had not done any sizing. Our Product Owner and business stakeholders were getting twitchy (“how long will we take?” – see How big is it?) and it was time to use our data to create some baselines for us to use going forward (and, as a side benefit, to find out what our velocity was).

Besides the fact that it was a new team, this team was also very large (15 people), some of them had never done an Affinity Sizing type exercise before, and we were 100% distributed (thanks to COVID19). Quite the facilitation challenge compared to the usual exercise requiring nothing more than a couple of index cards, masking tape and some planning poker cards. This is what I did and how it worked out.

1. Preparation

First, I needed something I could use to mimic the laying out of cards in a single view. As we’d already done three sprints of stories, there were a number of cards to distribute and I didn’t want to be limited to an A4 Word document page or Powerpoint slide. This meant a whiteboard (unlimited space) was required and we eventually ended up using a free version of  Miro.

Second, with my tool selected, I needed to make sure everyone in the team could actually access/use the tool. Unfortunately, Miro does require one to create an account, so prior to the workshop I sent a request to everyone on the team to try and access an “icebreaker” board.

Third, I needed to prepare my two boards:

  • The Icebreaker board which was to serve three purposes:
    1. Give people something to play around with so they could practise dragging and interacting with Miro
    2. Set the scene in terms of how sizing is different to estimating. Hopefully as a reminder to those who already knew, or as an eye-opener to those who might not.
    3. Use a similar format/process to the board I would be using for the Affinity Estimation exercise so that the team could get used to the process in a “safe” context before doing the “real thing”.
  • The Affinity Estimation board and related facilitation resources.

The Icebreaker Board

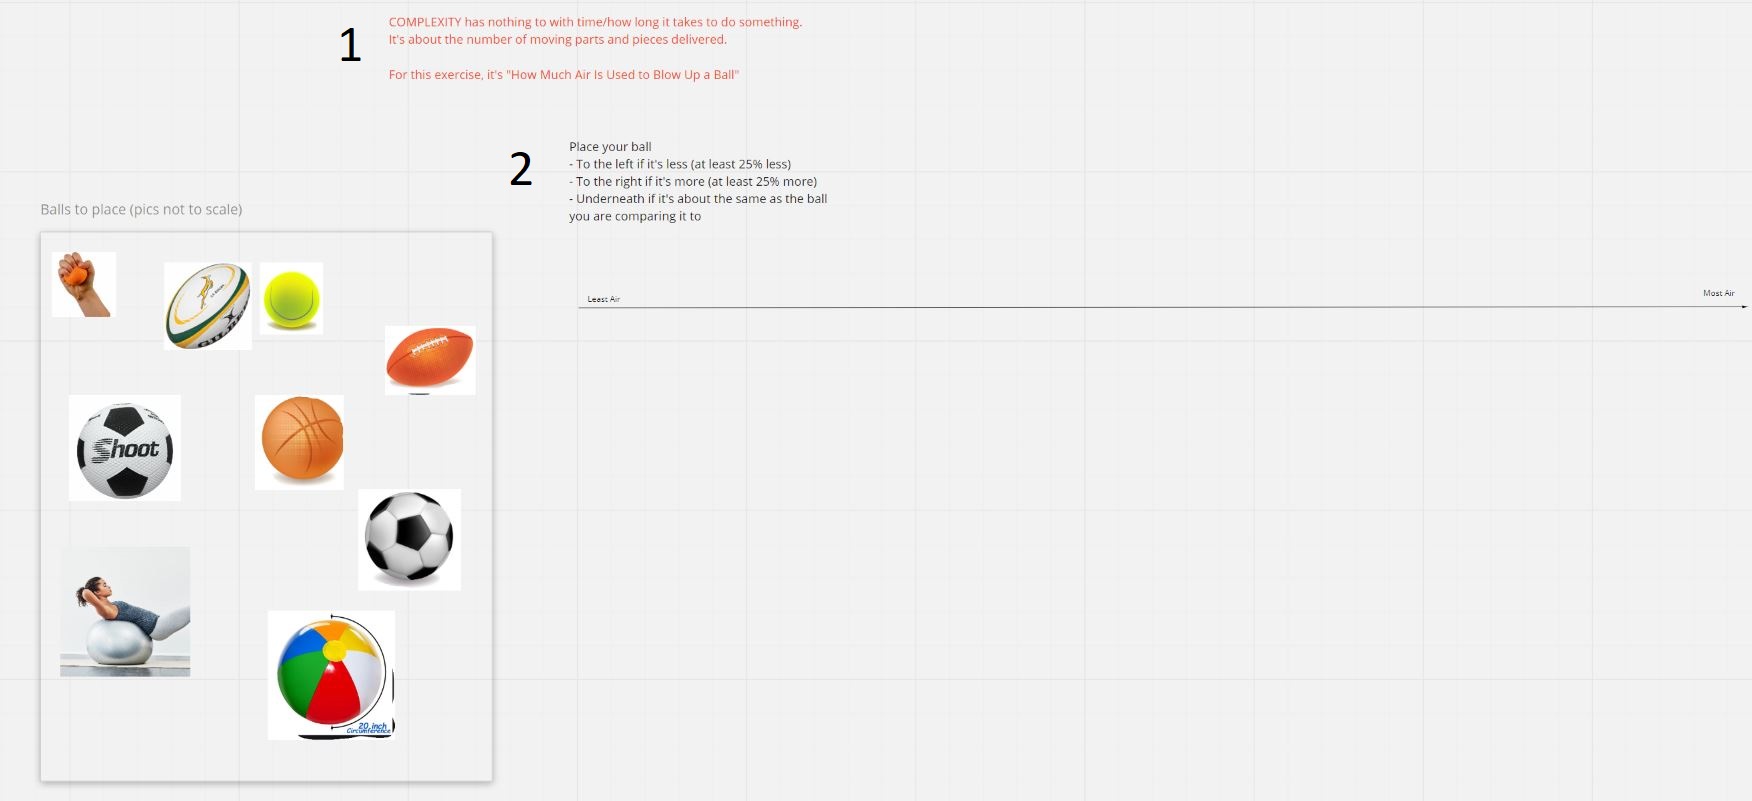
Ball game start

This layout matched the starting point of the Affinity Estimation exercise.

There was a reminder of what “size” was for the purposes of the exercise in red (1) and instructions for how to add the items to the scale (2). The block on the left was for the “stories” (balls) that needed to be arranged on the scale.

The Affinity Sizing Board

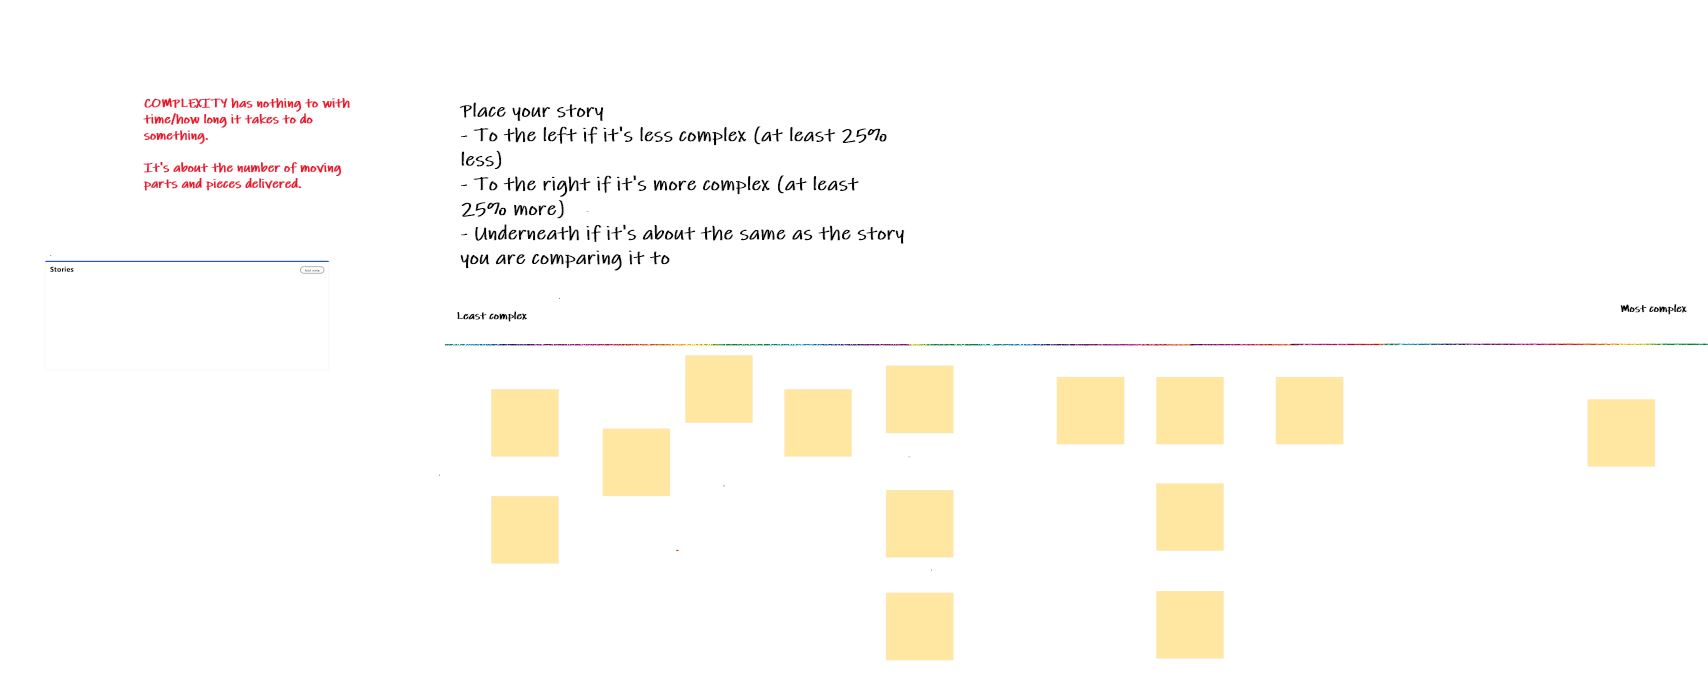
(I forgot to take a screenshot of the blank version, so this is a “simulation” of what it looked like.)

same blank stories

“Simulation”

For the Affinity Sizing, besides the board, I also prepared a few more things:

  1. A list of the stories (from JIRA) including their JIRA number and story title in a format that would be easy to copy and paste.
  2. The description of each story (from JIRA) prefixed with the JIRA number in a format that was easy to copy and paste
  3. I asked one of the team members if they would be prepared to track the exercise and ensure we didn’t accidentally skip a story.

A reminder that at the point when we did this exercise, we were about to end our third sprint, so we used all the stories from our first three sprints for the workshop (even the ones still in progress).

2. The session

The session was done in Zoom and started with the usual introduction: what was the purpose and desired outcomes.

From there, I asked the team members to access the “icebreaker board”. In the end, I had to leave the team to figure out how to use this board for themselves while I dealt with some technical issues certain team members were experiencing, so couldn’t observe what happened. However, when I was able to get back to them, I was happy enough with the final outcome to move on.

balls 2

Round 1: Small to Large

To kick things off, I copied and pasted the first story from my prepared list (random order) into a sticky and the story description (in case people needed more detail) into a separate “reference” block on the edge of the whiteboard. The first person to go then had to drag the story to where they thought it best fit on the scale.

From the second person onwards, we went down the list and asked each person whether they:

  1. Wanted to move any of the story-stickies that had already been placed or,
  2. Wanted a new story to add to the scale

A note here – it might be tempting to have some team members observe rather than participate (e.g. your designer or a brand new team member); however, I find that because mistakes will self-correct, there is more benefit in including everyone in the process.

We repeated the process until all the stories had been placed on the scale. At this point, it looked something like this (again, a “simulation”):

round 1 Round 2: Buckets

At this point I used two data points to make an educated “guess” to create a reference point.

  1. I knew that our biggest story to date was of a size that we could probably fit 2-3 of them in a sprint
  2. I could see where the stories had “bunched” on the scale.

So I picked the first biggest bunch and created a bucket for them which I numbered “5”. Then I drew buckets to the left (1,2,3) and to the right (8,13,20) and moved everything that wasn’t in the “5” bucket down to below the updated scale/grid (but still in the same order left-to-right).

buckets

Before we continued, I checked with the team whether the felt all the stories in the 5-bucket were actually about the same size. They did (but if there had been one that they felt might not be, it would have been moved out to join the others below the buckets). After this point, the stickies that had been placed in bucket five at the start of the process were fixed/locked i.e. they could not move.

Then we repeated the process again where each person was asked whether they

  1. Wanted to move a story-sticky that had already been placed into a bucket, or
  2. Move one of the unplaced story-stickies into a bucket

Initially, some people moved a couple of stories on their turn into buckets, which I didn’t object to as long as they were moving them all into the same bucket. Again, I was confident that the team would self-correct any really off assumptions.

We had one story that moved back-and-forth between bucket 1 and 2 a few times, and eventually, the team had a more detailed discussion and made a call and that story wasn’t allowed to move again (I also flagged it as a bad baseline and didn’t include it in future sizing conversations).

Once all the story-stickies had been placed in a bucket, everyone had one last turn to either approve the board or move something. When we got through a round of everyone with no moves, the exercise was done:

stories

The actual outcome of the workshop

Even with technical difficulties and approximately 15 people in the room, we got all of this done in 90 minutes. This is still longer than it would usually take face-to-face (I’d have expected to have needed half the time for a collocated session), but I thought it was pretty good going. And the feedback from the participants was also generally positive 🙂

These stories (except for the one I mentioned) then became baseline stories for comparing to when we did future backlog refinement. Also, because I now knew the total number of points the team had completed in the three sprints (sum of all the stories), we also now knew what our initial velocity was.

Have you ever tried to use Affinity Estimation to determine baselines? Have you tried to do so with a distributed team? What tools did you use? How did it go?


Velocity: a dangerous metric

Posted: July 10, 2014 in Agile, Team
Tags: ,